画像解析で検証、SILKYPIXは必要なのか?

RICOH GR IIIx HDFを購入してから、画像フォーマットをJPEGでなくRAW形式で運用し ています。RAW画像を現像するために、市川ソフトラボラトリー1の SILKPIX Developer Studio Pro11を使っていますが、 使い続ける価値があるかどうか気になっていました。
理由は、SILKYPIXはRAW現像の時間がかかる上に、プレビュー動作が非常に重たいからです。 特にプレビューの動作の問題は深刻で、しばらく使っているとフリーズしてしまうことも多く、 SILKYPIXのMac版はWindowsよりバージョンが一つ古いこともあり、 macOSの最適化の点で技術力に問題があるか、もしかするとバグがあるのかもと疑い たくなります。
macOSがRAWファイルをサポートしているので、今では多くのアプリでRAWファイルを 扱えます。特にPixelmator ProなどはmacOSに最適化されているため、RAW現像も非常 に高速です。
そのため、「SILKYPIXを使い続ける意味があるのか」と考えてしまうわけです。
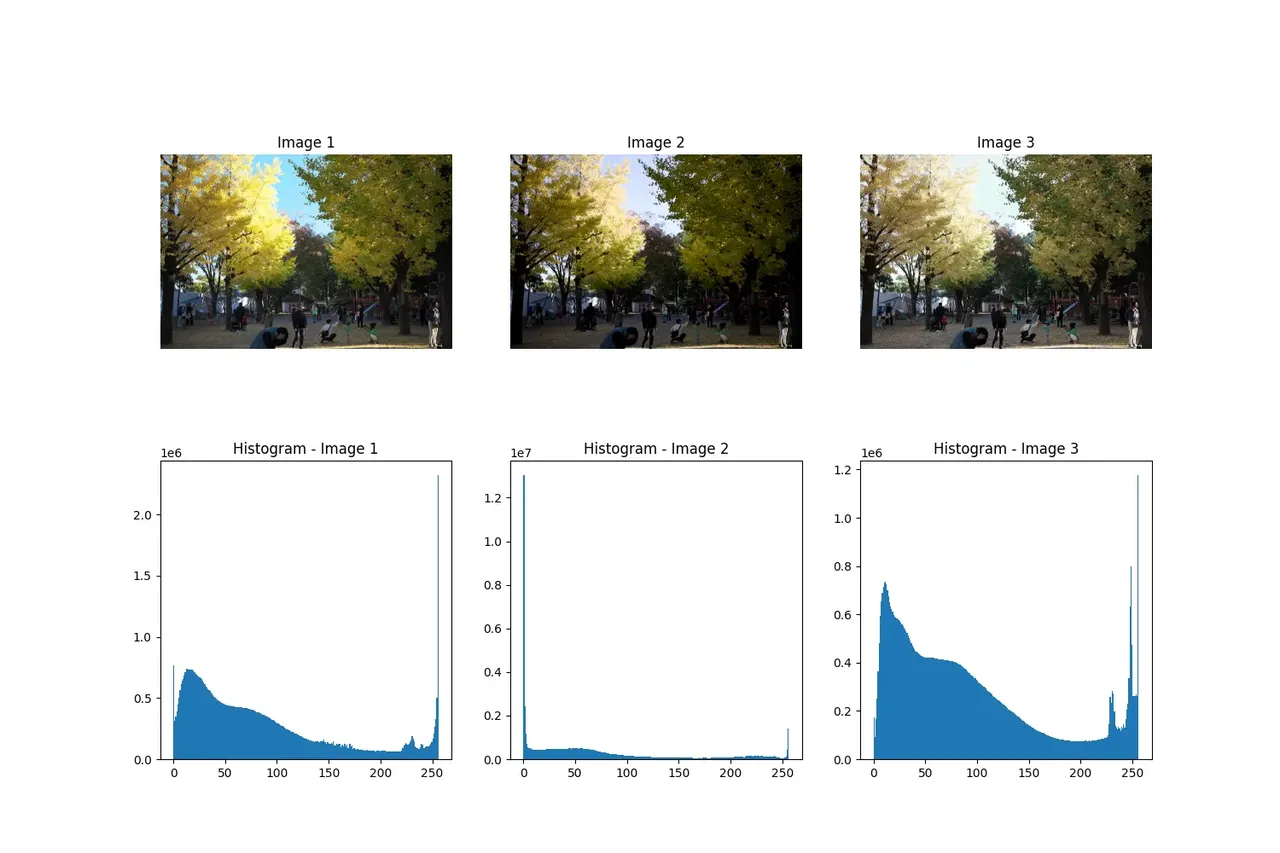
今回はPython で画像を比較するツールを書いて、次の3つの画像を比較し データでその品質を検証してました。
比較は、以下の3つです。
- Image1: Mac版のSILKYPIXで現像したJpeg File。調整は何も行っていない。
- Image2: Pixelmator Proで現像したJpeg File。調整は何も行っていない。
- Image3: GR IIIxで撮影時にJpegで保管したもの。ただし、Image Controlでネガフィルム調を指定
画像解析でJPEGファイルを比較
解析に使用したプログラムは、記事の最後に掲載しておきます。
検証に使用した画像は、ちょっと西日が紅葉に指している公園の風景です。暗い木が 茂っている部分と西日が差している紅葉部分で明度の差が激しく難しい画像だと思い ます。
結果は次のようになりました。

詳細データです。
❯ python three-image-comparison.py

Image 1 Analysis:
Size: (4000, 6000, 3)
Mean Brightness: 85.267
Standard Deviation: 72.58
Mean Saturation: 113.675
Contrast: 255
File Size(KB): 19070.3955078125

Image 2 Analysis:
Size: (4000, 6000, 3)
Mean Brightness: 66.147
Standard Deviation: 73.611
Mean Saturation: 135.691
Contrast: 255
File Size(KB): 29992.3681640625

Image 3 Analysis:
Size: (4000, 6000, 3)
Mean Brightness: 93.122
Standard Deviation: 74.255
Mean Saturation: 85.623
Contrast: 255
File Size(KB): 13395.0634765625

Comparison Results:
SSIM 1-2: 0.68
SSIM 1-3: 0.847
SSIM 2-3: 0.737
Histogram Correlation 1-2: 0.3822719180861183
Histogram Correlation 1-3: 0.7985840630919663
Histogram Correlation 2-3: 0.13442670111231494
Size: (4000, 6000, 3)
Bit Depth 1: uint8
Bit Depth 2: uint8
Bit Depth 3: uint8
画像比較結果
データからわかる各画像の特性は、次の通りです。
- SILKYPIXの画像
- 中間的な明るさで落ち着いたトーン
- 適度に彩度が高く、鮮やかさと自然さを両立
- 明るさが安定しており、均一な仕上がり
- Pixelmator Proの画像
- 最も暗めの仕上がり。陰影が強調されている
- 最も彩度が高く、鮮やかさが重視されている
- トーンの変化がダイナミックで、劇的な印象
- GR IIIxのJpeg画像(ネガフィルム調)
- 最も明るい仕上がりで、軽やかで柔らかいトーン
- 最も彩度が低めで落ち着いたナチュラルな色彩。
- 明るさの変化が適度で、自然なグラデーション
比較結果では、次のような結果となっている。
- SSIM(構造的類似性指数)からは、SILKYPIXとPixelmator Proは全体の構造がかな りことなり、明るさと彩度が大きく違う。GR IIIxのJpegはどちかというとSILKYPIXに近いが、彩度が控えめ。
- ヒストグラム相関から、SILKYPIXとPixelmator Proは色分布が大きく異なってい る。GR IIIxのJpeg と比較するとSILKYPIXは類似性があり、Pixelmator Proは大きく違っている。
画像比較結果からのアプリの評価
画像の比較からだけ見ると次のような結論になります。
- SILKYPIXは鮮やかな彩度とバランスのよい明るさで、自然なトーンと適度な色彩の鮮やかさが求められる ポートレートや風景写真などに向いている。バランスがよく汎用的が高い。
- Pixelmator Proは、鮮やかな色彩とダイナミックなトーンで、広告やアート作品が向いている。やや暗めで撮影時と大きく印象が違っているため、劇的な表現になるがテーマを選んでしまう可能性が高い。素材により暗すぎる点が問題。
- GR IIIxのJpeg画像はネガフィルム調を使っていることが大きいが、明るく柔らか いトーンで日常写真など落ち着いた印象がよい。
この画像だけで言うと、やはりSILKYPIXはそれなりによいし、数値でも確認できた。 逆にPixelmator Proはグラフィックにはよいが、写真には少しわざとらしさが出てし まう印象を持った。
ただし、両ソフトとも何も調整していないので、自動調整などの機能をそれぞれ持っ ているので、調整を入れると大きく違いが出る可能性もある。
意外だったのが、GR IIIx自体のJpeg、しかもImage Controlのネガフィルム調が個人 的に気に入ったこと。明るく軽やかで味がある表現となっている。
これであれば、RAW + JPEGで撮影して、問題なければGR IIIxのJPEGを使い、調整が必要ならば SILKYPIXで追い込んで現像というのよさそう。
分析に使用したプログラム
やっつけ仕事で作ったので、入力ファイル名とかベタ書きしてしまっています。
import numpy as np
from PIL import Image
import matplotlib.pyplot as plt
from skimage.metrics import structural_similarity as ssim
import cv2
import os


def compare_three_images(image1_path, image2_path, image3_path, output_path=None):
    """
    Compare three images and analyze them using various metrics

    Parameters:
    image1_path (str): Path to first image
    image2_path (str): Path to second image
    image3_path (str): Path to third image
    output_path (str): Path to save comparison results (optional)

    Returns:
    dict: Comparison metrics
    """
    # Load images
    img1 = cv2.imread(image1_path, cv2.IMREAD_UNCHANGED)
    img2 = cv2.imread(image2_path, cv2.IMREAD_UNCHANGED)
    img3 = cv2.imread(image3_path, cv2.IMREAD_UNCHANGED)

    if img1 is None or img2 is None or img3 is None:
        raise ValueError("Failed to load one or more images")

    # Normalize to 8-bit if necessary for visualization
    def normalize_to_8bit(img):
        if img.dtype != np.uint8:
            return cv2.normalize(img, None, 0, 255, cv2.NORM_MINMAX, dtype=cv2.CV_8U)
        return img

    img1_8bit = normalize_to_8bit(img1)
    img2_8bit = normalize_to_8bit(img2)
    img3_8bit = normalize_to_8bit(img3)

    # Convert to grayscale for SSIM
    gray1 = cv2.cvtColor(img1_8bit, cv2.COLOR_BGR2GRAY)
    gray2 = cv2.cvtColor(img2_8bit, cv2.COLOR_BGR2GRAY)
    gray3 = cv2.cvtColor(img3_8bit, cv2.COLOR_BGR2GRAY)

    # Calculate SSIM between each pair
    ssim_1_2 = ssim(gray1, gray2)
    ssim_1_3 = ssim(gray1, gray3)
    ssim_2_3 = ssim(gray2, gray3)

    # Compare histograms between each pair
    def calculate_hist_correlation(img1, img2):
        hist1 = cv2.calcHist([img1], [0], None, [256], [0, 256])
        hist2 = cv2.calcHist([img2], [0], None, [256], [0, 256])
        return cv2.compareHist(hist1, hist2, cv2.HISTCMP_CORREL)

    hist_corr_1_2 = calculate_hist_correlation(img1_8bit, img2_8bit)
    hist_corr_1_3 = calculate_hist_correlation(img1_8bit, img3_8bit)
    hist_corr_2_3 = calculate_hist_correlation(img2_8bit, img3_8bit)

    # Visualization
    plt.figure(figsize=(15, 10))

    # Images
    plt.subplot(231)
    plt.imshow(cv2.cvtColor(img1_8bit, cv2.COLOR_BGR2RGB))
    plt.title("Image 1")
    plt.axis("off")

    plt.subplot(232)
    plt.imshow(cv2.cvtColor(img2_8bit, cv2.COLOR_BGR2RGB))
    plt.title("Image 2")
    plt.axis("off")

    plt.subplot(233)
    plt.imshow(cv2.cvtColor(img3_8bit, cv2.COLOR_BGR2RGB))
    plt.title("Image 3")
    plt.axis("off")

    # Histograms
    plt.subplot(234)
    plt.hist(img1_8bit.ravel(), 256, [0, 256])
    plt.title("Histogram - Image 1")

    plt.subplot(235)
    plt.hist(img2_8bit.ravel(), 256, [0, 256])
    plt.title("Histogram - Image 2")

    plt.subplot(236)
    plt.hist(img3_8bit.ravel(), 256, [0, 256])
    plt.title("Histogram - Image 3")

    if output_path:
        plt.savefig(output_path)

    plt.close()

    return {
        "SSIM 1-2": ssim_1_2,
        "SSIM 1-3": ssim_1_3,
        "SSIM 2-3": ssim_2_3,
        "Histogram Correlation 1-2": hist_corr_1_2,
        "Histogram Correlation 1-3": hist_corr_1_3,
        "Histogram Correlation 2-3": hist_corr_2_3,
        "Size": img1.shape,
        "Bit Depth 1": str(img1.dtype),
        "Bit Depth 2": str(img2.dtype),
        "Bit Depth 3": str(img3.dtype),
    }


def analyze_image(image_path):
    """
    1枚の画像の詳細な分析を行います

    Parameters:
    image_path (str): 画像のパス

    Returns:
    dict: 画像の分析結果
    """
    img = cv2.imread(image_path)
    hsv = cv2.cvtColor(img, cv2.COLOR_BGR2HSV)

    return {
        "Size": img.shape,
        "Mean Brightness": np.mean(img),
        "Standard Deviation": np.std(img),
        "Mean Saturation": np.mean(hsv[:, :, 1]),
        "Contrast": np.max(img) - np.min(img),
        "File Size(KB)": os.path.getsize(image_path) / 1024,  # KB単位
    }


def format_results(results_dict):
    """
    Format the results dictionary for better readability
    """
    formatted = {}
    for key, value in results_dict.items():
        if isinstance(value, (np.float64, np.float32)):
            formatted[key] = float(round(value, 3))
        elif isinstance(value, np.uint8):
            formatted[key] = int(value)
        else:
            formatted[key] = value
    return formatted


if __name__ == "__main__":
    # Compare three images
    results = compare_three_images(
        "image1.jpg", "image2.jpg", "image3.jpg", "comparison_result.png"
    )

    # Analyze each image
    images = ["image1.jpg", "image2.jpg", "image3.jpg"]
    for i, image_path in enumerate(images, 1):
        analysis = analyze_image(image_path)
        print(f"\nImage {i} Analysis:")
        for key, value in format_results(analysis).items():
            print(f"{key}: {value}")

    print("\nComparison Results:")
    for key, value in format_results(results).items():
        print(f"{key}: {value}")
-
Windowsユーザーだったころ市川ラボラトリーの「デイジーアート」という画 像編集ソフトを愛用してたなぁ。今では別の会社から販売してて「教育機関向け」になっているが・・・ ↩
